Data (singular datum) are individual units of information.[1] A datum describes a single quality or quantity of some object or phenomenon. In analytical processes, data are represented by variables.
Although the terms "data", "information" and "knowledge" are often used interchangeably, each of these terms has a distinct meaning. In popular publications, data is sometimes said to be transformed into information when it is viewed in context or in post-analysis.[2]. In academic treatments of the subject, however, data are simply units of information. Data is employed in scientific research, businesses management (e.g., sales data, revenue, profits, stock price), finance, governance (e.g., crime rates, unemployment rates, literacy rates), and in virtually every other form of human organizational activity (e.g., censuses of the number of homeless people by non-profit organizations).
Data is measured, collected and reported, and analyzed, whereupon it can be visualized using graphs, images or other analysis tools. Data as a general concept refers to the fact that some existing information or knowledge is represented or coded in some form suitable for better usage or processing. Raw data ("unprocessed data") is a collection of numbers or characters before it has been "cleaned" and corrected by researchers. Raw data needs to be corrected to remove outliers or obvious instrument or data entry errors (e.g., a thermometer reading from an outdoor Arctic location recording a tropical temperature). Data processing commonly occurs by stages, and the "processed data" from one stage may be considered the "raw data" of the next stage. Field data is raw data that is collected in an uncontrolled "in situ" environment. Experimental data is data that is generated within the context of a scientific investigation by observation and recording. Data has been described as the new oil of the digital economy
Abstract
This article highlights some of the basic concepts of bioinformatics and data mining. The major research areas of bioinformatics are highlighted.
The application of data mining in the domain of bioinformatics is explained. It also highlights some of the current challenges and opportunities of
data mining in bioinformatics.
Keywords: Data Mining, Bioinformatics, Protein Sequences Analysis, Bioinformatics Tools.
1. Introduction
In recent years, rapid developments in genomics and proteomics have generated a large amount of biological data.
Drawing conclusions from these data requires sophisticated computational analyses. Bioinformatics, or
computational biology, is the interdisciplinary science of interpreting biological data using information technology
and computer science. The importance of this new field of inquiry will grow as we continue to generate and
integrate large quantities of genomic, proteomic, and other data.
A particular active area of research in bioinformatics is the application and development of data mining
techniques to solve biological problems. Analyzing large biological data sets requires making sense of the data by
inferring structure or generalizations from the data. Examples of this type of analysis include protein structure
prediction, gene classification, cancer classification based on microarray data, clustering of gene expression data,
statistical modeling of protein-protein interaction, etc. Therefore, we see a great potential to increase the interaction
between data mining and bioinformatics.
2. Bioinformatics
The term bioinformatics was coined by Paulien Hogeweg in 1979 for the study of informatic processes in biotic
systems. It was primary used since late 1980s has been in genomics and genetics, particularly in those areas of
genomics involving large-scale DNA sequencing.
Bioinformatics can be defined as the application of computer technology to the management of biological
information. Bioinformatics is the science of storing, extracting, organizing, analyzing, interpreting and utilizing
information from biological sequences and molecules. It has been mainly fueled by advances in DNA sequencing
and mapping techniques. Over the past few decades rapid developments in genomic and other molecular research
technologies and developments in information technologies have combined to produce a tremendous amount of
information related to molecular biology. The primary goal of bioinformatics is to increase the understanding of
biological processes.
Some of the grand area of research in bioinformatics includes:
2.1. Sequence analysis
Sequence analysis is the most primitive operation in computational biology. This operation consists of finding which
part of the biological sequences are alike and which part differs during medical analysis and genome mapping
processes. The sequence analysis implies subjecting a DNA or peptide sequence to sequence alignment, sequence
databases, repeated sequence searches, or other bioinformatics methods on a computer.
2.2. Genome annotation
In the context of genomics, annotation is the process of marking the genes and other biological features in a DNA
sequence. The first genome annotation software system was designed in 1995 by Dr. Owen White.
2.3. Analysis of gene expression
The expression of many genes can be determined by measuring mRNA levels with various techniques such as
microarrays, expressed cDNA sequence tag (EST) sequencing, serial analysis of gene expression (SAGE) tag
sequencing, massively parallel signature sequencing (MPSS), or various applications of multiplexed in-situ
hybridization etc. All of these techniques are extremely noise-prone and subject to bias in the biological
measurement. Here the major research area involves developing statistical tools to separate signal from noise in
high-throughput gene expression studies.
2.4. Analysis of protein expression
Gene expression is measured in many ways including mRNA and protein expression, however protein expression is
one of the best clues of actual gene activity since proteins are usually final catalysts of cell activity. Protein
microarrays and high throughput (HT) mass spectrometry (MS) can provide a snapshot of the proteins present in a
biological sample. Bioinformatics is very much involved in making sense of protein microarray and HT MS data.
2.5. Analysis of mutations in cancer
In cancer, the genomes of affected cells are rearranged in complex or even unpredictable ways. Massive sequencing
efforts are used to identify previously unknown point mutations in a variety of genes in cancer. Bioinformaticians
continue to produce specialized automated systems to manage the sheer volume of sequence data produced, and they
create new algorithms and software to compare the sequencing results to the growing collection of human genome
sequences and germline polymorphisms. New physical detection technologies are employed, such as oligonucleotide
microarrays to identify chromosomal gains and losses and single-nucleotide polymorphism arrays to detect known
point mutations. Another type of data that requires novel informatics development is the analysis of lesions found to
be recurrent among many tumors.
2.6. Protein structure prediction
The amino acid sequence of a protein (so-called, primary structure) can be easily determined from the sequence on
the gene that codes for it. In most of the cases, this primary structure uniquely determines a structure in its native
environment. Knowledge of this structure is vital in understanding the function of the protein. For lack of better
terms, structural information is usually classified as secondary, tertiary and quaternary structure. Protein structure
prediction is one of the most important for drug design and the design of novel enzymes. A general solution to such
predictions remains an open problem for the researchers.
2.7. Comparative genomics
Comparative genomics is the study of the relationship of genome structure and function across different biological
species. Gene finding is an important application of comparative genomics, as is discovery of new, non-coding
functional elements of the genome. Comparative genomics exploits both similarities and differences in the proteins,
RNA, and regulatory regions of different organisms. Computational approaches to genome comparison have
recently become a common research topic in computer science.
2.8. Modeling biological systems
Modeling biological systems is a significant task of systems biology and mathematical biology. Computational
systems biology aims to develop and use efficient algorithms, data structures, visualization and communication tools
for the integration of large quantities of biological data with the goal of computer modeling. It involves the use of
computer simulations of biological systems, like cellular subsystems such as the networks of metabolites and
enzymes, signal transduction pathways and gene regulatory networks to both analyze and visualize the complex
connections of these cellular processes. Artificial life is an attempt to understand evolutionary processes via the
computer simulation of simple life forms
2.9. High-throughput image analysis
Computational technologies are used to accelerate or fully automate the processing, quantification and analysis of
large amounts of high-information-content biomedical images. Modern image analysis systems augment an
observer's ability to make measurements from a large or complex set of images. A fully developed analysis system
may completely replace the observer. Biomedical imaging is becoming more important for both diagnostics and
research. Some of the examples of research in this area are: clinical image analysis and visualization, inferring clone
overlaps in DNA mapping, Bioimage informatics, etc.
2.10. Protein-protein docking
In the last two decades, tens of thousands of protein three-dimensional structures have been determined by X-ray
crystallography and Protein nuclear magnetic resonance spectroscopy (protein NMR). One central question for the
biological scientist is whether it is practical to predict possible protein-protein interactions only based on these 3D
shapes, without doing protein-protein interaction experiments. A variety of methods have been developed to tackle
the Protein-protein docking problem, though it seems that there is still much work to be done in this field.
3. Bioinformatics Tools
Following are the some of the important tools for bioinformatics (Table 1)
Table 1: Some of the tools for bioinformatics
Bioinformatics Research Area Tool (Application) References
Sequence alignment BLAST http://blast.ncbi.nlm.nih.gov/Blast.cgi
CS-BLAST ftp://toolkit.lmb.uni-muenchen.de/csblast/
HMMER http://hmmer.janelia.org/
FASTA www.ebi.ac.uk/fasta33
Multiple sequence alignment MSAProbs http://msaprobs.sourceforge.net/
DNA Alignment http://www.fluxus-engineering.com/align.htm
MultAlin http://multalin.toulouse.inra.fr/multalin/multalin.html
DiAlign http://bibiserv.techfak.uni-bielefeld.de/dialign/
Gene Finding GenScan genes.mit.edu/GENSCAN.html
GenomeScan http://genes.mit.edu/genomescan.html
GeneMark http://exon.biology.gatech.edu/
Protein Domain Analysis Pfam http://pfam.sanger.ac.uk/
BLOCKS http://blocks.fhcrc.org/
ProDom http://prodom.prabi.fr/prodom/current/html/home.php
Pattern Identification Gibbs Sampler http://bayesweb.wadsworth.org/gibbs/gibbs.html
AlignACE http://atlas.med.harvard.edu/
MEME http://meme.sdsc.edu/
Genomic Analysis SLAM http://bio.math.berkeley.edu/slam/
Multiz http://www.bx.psu.edu/miller_lab/
Motif finding MEME/MAST http://meme.sdsc.edu
eMOTIF http://motif.stanford.edu
4. Data Mining
Data mining refers to extracting or “mining” knowledge from large amounts of data. Data Mining (DM) is the
science of finding new interesting patterns and relationship in huge amount of data. It is defined as “the process of
discovering meaningful new correlations, patterns, and trends by digging into large amounts of data stored in
warehouses”. Data mining is also sometimes called Knowledge Discovery in Databases (KDD). Data mining is not
specific to any industry. It requires intelligent technologies and the willingness to explore the possibility of hidden
knowledge that resides in the data.
Data Mining approaches seem ideally suited for Bioinformatics, since it is data-rich, but lacks a comprehensive
theory of life’s organization at the molecular level. The extensive databases of biological information create both
challenges and opportunities for development of novel KDD methods. Mining biological data helps to extract useful
knowledge from massive datasets gathered in biology, and in other related life sciences areas such as medicine and
neuroscience.
4.1. Data mining tasks
The two "high-level" primary goals of data mining, in practice, are prediction and description. The main tasks wellsuited
for data mining, all of which involves mining meaningful new patterns from the data, are:
Classification: Classification is learning a function that maps (classifies) a data item into one of several predefined
classes.
Estimation: Given some input data, coming up with a value for some unknown continuous variable.
Prediction: Same as classification & estimation except that the records are classified according to some future
behaviour or estimated future value).
Association rules: Determining which things go together, also called dependency modeling.
Clustering: Segmenting a population into a number of subgroups or clusters.
Description & visualization: Representing the data using visualization techniques.
Learning from data falls into two categories: directed (“supervised”) and undirected (“unsupervised”) learning.
The first three tasks – classification, estimation and prediction – are examples of supervised learning. The next three
tasks – association rules, clustering and description & visualization – are examples of unsupervised learning. In
unsupervised learning, no variable is singled out as the target; the goal is to establish some relationship among all
the variables. Unsupervised learning attempts to find patterns without the use of a particular target field.
The development of new data mining and knowledge discovery tools is a subject of active research. One
motivation behind the development of these tools is their potential application in modern biology.
5. Application of Data Mining in Bioinformatics
Applications of data mining to bioinformatics include gene finding, protein function domain detection, function
motif detection, protein function inference, disease diagnosis, disease prognosis, disease treatment optimization,
protein and gene interaction network reconstruction, data cleansing, and protein sub-cellular location prediction.
For example, microarray technologies are used to predict a patient’s outcome. On the basis of patients’ genotypic
microarray data, their survival time and risk of tumor metastasis or recurrence can be estimated. Machine learning
can be used for peptide identification through mass spectroscopy. Correlation among fragment ions in a tandem
mass spectrum is crucial in reducing stochastic mismatches for peptide identification by database searching. An
efficient scoring algorithm that considers the correlative information in a tunable and comprehensive manner is
highly desirable.
6. Conclusion and challenges
Bioinformatics and data mining are developing as interdisciplinary science. Data mining approaches seem ideally
suited for bioinformatics, since bioinformatics is data-rich but lacks a comprehensive theory of life’s organization at
the molecular level.
However, data mining in bioinformatics is hampered by many facets of biological databases, including their size,
number, diversity and the lack of a standard ontology to aid the querying of them as well as the heterogeneous data
of the quality and provenance information they contain. Another problem is the range of levels the domains of
expertise present amongst potential users, so it can be difficult for the database curators to provide access
mechanism appropriate to all. The integration of biological databases is also a problem. Data mining and
bioinformatics are fast growing research area today. It is important to examine what are the important research
issues in bioinformatics and develop new data mining methods for scalable and effective analysis.
Data Types & File Formats
What types of data are we talking about?
Data can mean many different things, and there are many ways to classify it. Two of the more common are:
- Primary and Secondary: Primary data is data that you collect or generate. Secondary data is created by other researchers, and could be their primary data, or the data resulting from their research.
- Qualitative and Quantitative: Qualitative refers to text, images, video, sound recordings, observations, etc. Quantitative refers to numerical data.
There are typically five main categories that it can be sorted into for management purposes. The category that you choose will then have an effect upon the choices that you make throughout the rest of your data management plan.
Observational
- Captured in real-time
- Cannot be reproduced or recaptured. Sometimes called ‘unique data’.
- Examples include sensor readings, telemetry, survey results, images, and human observation.
Experimental
- Data from lab equipment and under controlled conditions
- Often reproducible, but can be expensive to do so
- Examples include gene sequences, chromatograms, magnetic field readings, and spectroscopy.
Simulation
- Data generated from test models studying actual or theoretical systems
- Models and metadata where the input more important than the output data
- Examples include climate models, economic models, and systems engineering.
Derived or compiled
- The results of data analysis, or aggregated from multiple sources
- Reproducible (but very expensive)
- Examples include text and data mining, compiled database, and 3D models
Reference or canonical
- Fixed or organic collection datasets, usually peer-reviewed, and often published and curated
- Examples include gene sequence databanks, census data, chemical structures.
Data can come in many forms. Some common ones are text, numeric, multimedia, models, audio, code, software, discipline specific (i.e., FITS in astronomy, CIF in chemistry), video, and instrument.
What are the issues around file formats?
File Formats should be chosen to ensure sharing, long-term access and preservation of your data. Choose open standards and formats that are easy to reuse. If you are using a different format during the collection and analysis phases of your research, be sure to include information in your documentation about features that may be lost when the files are migrated to their preservation format, as well as any specific software that will be necessary to view or work with the data.
Best practice for file format selection include:
- non-proprietary
- unencrypted
- uncompressed
- open, documented standard
- commonly used by your research community
- use common character encodings – ASCII, Unicode, UTF-8
Remember to retain your original unedited raw data in its native formats as your source data. Do not alter or edit it. Document the tools, instruments, or software used in its creation. Make a copy of it prior to any analysis or data manipulations.
Recommended Digital Data Formats:
Text, Documentation, Scripts: XML, PDF/A, HTML, Plain Text.
Still Image: TIFF, JPEG 2000, PNG, JPEG/JFIF, DNG (digital negative), BMP, GIF.
Geospatial: Shapefile (SHP, DBF, SHX), GeoTIFF, NetCDF.
Graphic Image:
- raster formats: TIFF, JPEG2000, PNG, JPEG/JFIF, DNG, BMP, GIF.
- vector formats: Scalable vector graphics, AutoCAD Drawing Interchange Format, Encapsulated Postscripts, Shape files.
- cartographic: Most complete data, GeoTIFF, GeoPDF, GeoJPEG2000, Shapefile.
Audio: WAVE, AIFF, MP3, MXF, FLAC.
Video: MOV, MPEG-4, AVI, MXF.
Database: XML, CSV, TAB.
file format
Posted by: Margaret Rouse
WhatIs.com
In a computer, a file format is the layout of a file in terms of how the data within the file is organized. A program that uses the data in a file must be able to recognize and possibly access data within the file. For example, the program that we call a Web browser is able to process and display a file in the HTML file format so that it appears as a Web page, but it cannot display a file in a format designed for Microsoft's Excel program. A particular file format is often indicated as part of a file's name by a file name extension (suffix). Conventionally, the extension is separated by a period from the name and contains three or four letters that identify the format. A program that uses or recognizes a particular file format may or may not care whether the file has the appropriate extension name since it can actually examine the bits in the file to see whether the format (layout) is one it recognizes.
There are as many different file formats as there are different programs to process the files. A few of the more common file formats are:
Word documents (.doc)
Web text pages (.htm or .html)
Web page images (.gif and .jpg)
Adobe Postcript files (.ps)
Adobe Acrobat files (.pdf)
Executable programs (.exe)
Multimedia files (.mp3 and others)
"Data! Data! Data! I can't make bricks without clay."
— Sherlock Holmes, in Arthur Conan Doyle's The Adventure of the Copper Beeches
Whether you're the world's greatest detective trying to crack a case or a person trying to solve a problem at work, you're going to need information. Facts. Data, as Sherlock Holmes says.
jujubes
But not all data is created equal, especially if you plan to analyze as part of a quality improvement project.
If you're using Minitab Statistical Software, you can access the Assistant to guide you through your analysis step-by-step, and help identify the type of data you have.
But it's still important to have at least a basic understanding of the different types of data, and the kinds of questions you can use them to answer.
In this post, I'll provide a basic overview of the types of data you're likely to encounter, and we'll use a box of my favorite candy—Jujubes—to illustrate how we can gather these different kinds of data, and what types of analysis we might use it for.
The Two Main Flavors of Data: Qualitative and Quantitative
At the highest level, two kinds of data exist: quantitative and qualitative.
Quantitative data deals with numbers and things you can measure objectively: dimensions such as height, width, and length. Temperature and humidity. Prices. Area and volume.
Qualitative data deals with characteristics and descriptors that can't be easily measured, but can be observed subjectively—such as smells, tastes, textures, attractiveness, and color.
Broadly speaking, when you measure something and give it a number value, you create quantitative data. When you classify or judge something, you create qualitative data. So far, so good. But this is just the highest level of data: there are also different types of quantitative and qualitative data.
Quantitative Flavors: Continuous Data and Discrete Data
There are two types of quantitative data, which is also referred to as numeric data: continuous and discrete. As a general rule, counts are discrete and measurements are continuous.
Discrete data is a count that can't be made more precise. Typically it involves integers. For instance, the number of children (or adults, or pets) in your family is discrete data, because you are counting whole, indivisible entities: you can't have 2.5 kids, or 1.3 pets.
Continuous data, on the other hand, could be divided and reduced to finer and finer levels. For example, you can measure the height of your kids at progressively more precise scales—meters, centimeters, millimeters, and beyond—so height is continuous data.
If I tally the number of individual Jujubes in a box, that number is a piece of discrete data.
a count of jujubes is discrete data
If I use a scale to measure the weight of each Jujube, or the weight of the entire box, that's continuous data.
Continuous data can be used in many different kinds of hypothesis tests. For example, to assess the accuracy of the weight printed on the Jujubes box, we could measure 30 boxes and perform a 1-sample t-test.
Some analyses use continuous and discrete quantitative data at the same time. For instance, we could perform a regression analysis to see if the weight of Jujube boxes (continuous data) is correlated with the number of Jujubes inside (discrete data).
Qualitative Flavors: Binomial Data, Nominal Data, and Ordinal Data
When you classify or categorize something, you create Qualitative or attribute data. There are three main kinds of qualitative data.
Binary data place things in one of two mutually exclusive categories: right/wrong, true/false, or accept/reject.
Occasionally, I'll get a box of Jujubes that contains a couple of individual pieces that are either too hard or too dry. If I went through the box and classified each piece as "Good" or "Bad," that would be binary data. I could use this kind of data to develop a statistical model to predict how frequently I can expect to get a bad Jujube.
When collecting unordered or nominal data, we assign individual items to named categories that do not have an implicit or natural value or rank. If I went through a box of Jujubes and recorded the color of each in my worksheet, that would be nominal data.
This kind of data can be used in many different ways—for instance, I could use chi-square analysis to see if there are statistically significant differences in the amounts of each color in a box.
We also can have ordered or ordinal data, in which items are assigned to categories that do have some kind of implicit or natural order, such as "Short, Medium, or Tall." Another example is a survey question that asks us to rate an item on a 1 to 10 scale, with 10 being the best. This implies that 10 is better than 9, which is better than 8, and so on.
The uses for ordered data is a matter of some debate among statisticians. Everyone agrees its appropriate for creating bar charts, but beyond that the answer to the question "What should I do with my ordinal data?" is "It depends." Here's a post from another blog that offers an excellent summary of the considerations involved.
Additional Resources about Data and Distributions
For more fun statistics you can do with candy, check out this article (PDF format): Statistical Concepts: What M&M's Can Teach Us.
For a deeper exploration of the probability distributions that apply to different types of data, check out my colleague Jim Frost's posts about understanding and using discrete distributions and how to identify the distribution of your data.
Data format in information technology may refer to:
- Data type, constraint placed upon the interpretation of data in a type system
- Signal (electrical engineering), a format for signal data used in signal processing
- Recording format, a format for encoding data for storage on a storage medium
- File format, a format for encoding data for storage in a computer file
- Container format (digital), a format for encoding data for storage by means of a standardized audio/video codecs file format
- Content format, a format for representing media content as data
- Audio format, a format for encoded sound data
- Video format, a format for encoded video data
DATA TYPES & FILE FORMATS
After defining what we mean by data, it is helpful to consider what types of data you create and/or work with, and what format those data take. Your data stewardship practices will be dictated by the types of data that you work with, and what format they are in.
Data Types
Data types generally fall into five categories:
Observational
- Captured in situ
- Can’t be recaptured, recreated or replaced
- Examples: Sensor readings, sensory (human) observations, survey results
- Captured in situ
- Can’t be recaptured, recreated or replaced
- Examples: Sensor readings, sensory (human) observations, survey results
Experimental
- Data collected under controlled conditions, in situ or laboratory-based
- Should be reproducible, but can be expensive
- Examples: gene sequences, chromatograms, spectroscopy, microscopy
- Data collected under controlled conditions, in situ or laboratory-based
- Should be reproducible, but can be expensive
- Examples: gene sequences, chromatograms, spectroscopy, microscopy
Derived or compiled
- Reproducible, but can be very expensive
- Examples: text and data mining, derived variables, compiled database, 3D models
- Reproducible, but can be very expensive
- Examples: text and data mining, derived variables, compiled database, 3D models
Simulation
- Results from using a model to study the behavior and performance of an actual or theoretical system
- Models and metadata, where the input can be more important than output data
- Examples: climate models, economic models, biogeochemical models
- Results from using a model to study the behavior and performance of an actual or theoretical system
- Models and metadata, where the input can be more important than output data
- Examples: climate models, economic models, biogeochemical models
Reference or canonical
- Static or organic collection [peer-reviewed] datasets, most probably published and/or curated.
- Examples: gene sequence databanks, chemical structures, census data, spatial data portals.
- Static or organic collection [peer-reviewed] datasets, most probably published and/or curated.
- Examples: gene sequence databanks, chemical structures, census data, spatial data portals.
Data Formats
Research data comes in many varied formats: text, numeric, multimedia, models, software languages, discipline specific (e.g. crystallographic information file (CIF) in chemistry), and instrument specific.
Formats more likely to be accessible in the future are:
- Non-proprietary
- Open, documented standards
- In common usage by the research community
- Using standard character encodings (ASCII, UTF-8)
- Uncompressed (desirable, space permitting)
- Non-proprietary
- Open, documented standards
- In common usage by the research community
- Using standard character encodings (ASCII, UTF-8)
- Uncompressed (desirable, space permitting)
Use the table below to find an appropriate and recommended format for preserving and sharing your data over the long term.
TYPE OF DATA | PREFERRED FILE FORMATS FOR SHARING, RE-USE AND PRESERVATION | Other Acceptable formats |
Quantitative tabular data with extensive metadata
|
| MS Access (.mdb/.accdb) |
Quantitative tabular data with minimal metadata
|
|
|
Geospatial data
vector and raster data
|
|
|
Qualitative data
textual
|
|
|
Digital image data | TIFF version 6 uncompressed (.tif) |
|
Digital audio data |
|
|
Digital video data |
| JPEG 2000 (.mj2) |
Documentation & Scripts |
|
|
Chemistry data
spectroscopy data and other plots which require the capability of representing contours as well as peak position and intensity
| Convert NMR, IR, Raman, UV and Mass Spectrometry files to JCAMP format for ease in sharing.
JCAMP file viewers: JSpecView, ChemDoodle
|
Introduction
If you have been part of the data science (or any data!) industry, you would know the challenge of working with different data types. Different formats, different compression, different parsing on different systems – you could be quickly pulling your hair! Oh and I have not talked about the unstructured data or semi-structured data yet.
For any data scientist or data engineer, dealing with different formats can become a tedious task. In real-world, people rarely get neat tabular data. Thus, it is mandatory for any data scientist (or a data engineer) to be aware of different file formats, common challenges in handling them and the best / efficient ways to handle this data in real life.
This article provides common formats a data scientist or a data engineer must be aware of. I will first introduce you to different common file formats used in the industry. Later, we’ll see how to read these file formats in Python.
P.S. In rest of this article, I will be referring to a data scientist, but the same applies to a data engineer or any data science professional.
Table of Contents
- What is a file format?
- Why should a data scientist understand different file formats?
- Different file formats and how to read them in Python?
- Comma-separated values
- XLSX
- ZIP
- Plain Text (txt)
- JSON
- XML
- HTML
- Images
- Hierarchical Data Format
- DOCX
- MP3
- MP4
1. What is a file format?
A file format is a standard way in which information is encoded for storage in a file. First, the file format specifies whether the file is a binary or ASCII file. Second, it shows how the information is organized. For example, comma-separated values (CSV) file format stores tabular data in plain text.
To identify a file format, you can usually look at the file extension to get an idea. For example, a file saved with name “Data” in “CSV” format will appear as “Data.csv”. By noticing “.csv” extension we can clearly identify that it is a “CSV” file and data is stored in a tabular format.

2. Why should a data scientist understand different file formats?
Usually, the files you will come across will depend on the application you are building. For example, in an image processing system, you need image files as input and output. So you will mostly see files in jpeg, gif or png format.
As a data scientist, you need to understand the underlying structure of various file formats, their advantages and dis-advantages. Unless you understand the underlying structure of the data, you will not be able to explore it. Also, at times you need to make decisions about how to store data.
Choosing the optimal file format for storing data can improve the performance of your models in data processing.
Now, we will look at the following file formats and how to read them in Python:
- Comma-separated values
- XLSX
- ZIP
- Plain Text (txt)
- JSON
- XML
- HTML
- Images
- Hierarchical Data Format
- DOCX
- MP3
- MP4
3. Different file formats and how to read them in Python
3.1 Comma-separated values
Comma-separated values file format falls under spreadsheet file format.
What is Spreadsheet File Format?
In spreadsheet file format, data is stored in cells. Each cell is organized in rows and columns. A column in the spreadsheet file can have different types. For example, a column can be of string type, a date type or an integer type. Some of the most popular spreadsheet file formats are Comma Separated Values ( CSV ), Microsoft Excel Spreadsheet ( xls ) and Microsoft Excel Open XML Spreadsheet ( xlsx ).
Each line in CSV file represents an observation or commonly called a record. Each record may contain one or more fields which are separated by a comma.
Sometimes you may come across files where fields are not separated by using a comma but they are separated using tab. This file format is known as TSV (Tab Separated Values) file format.
The below image shows a CSV file which is opened in Notepad.

Reading the data from CSV in Python
Let us look at how to read a CSV file in Python. For loading the data you can use the “pandas” library in python.
import pandas as pd
df = pd.read_csv(“/home/Loan_Prediction/train.csv”)
Above code will load the train.csv file in DataFrame df.
3.2 XLSX files
XLSX is a Microsoft Excel Open XML file format. It also comes under the Spreadsheet file format. It is an XML-based file format created by Microsoft Excel. The XLSX format was introduced with Microsoft Office 2007.
In XLSX data is organized under the cells and columns in a sheet. Each XLSX file may contain one or more sheets. So a workbook can contain multiple sheets.
The below image shows a “xlsx” file which is opened in Microsoft Excel.

In above image, you can see that there are multiple sheets present (bottom left) in this file, which are Customers, Employees, Invoice, Order. The image shows the data of only one sheet – “Invoice”.
Reading the data from XLSX file
Let’s load the data from XLSX file and define the sheet name. For loading the data you can use the Pandas library in python.
import pandas as pd
df = pd.read_excel(“/home/Loan_Prediction/train.xlsx”, sheetname = “Invoice”)
Above code will load the sheet “Invoice” from “train.xlsx” file in DataFrame df.
3.3 ZIP files
ZIP format is an archive file format.
What is Archive File format?
In Archive file format, you create a file that contains multiple files along with metadata. An archive file format is used to collect multiple data files together into a single file. This is done for simply compressing the files to use less storage space.
There are many popular computer data archive format for creating archive files. Zip, RAR and Tar being the most popular archive file format for compressing the data.
So, a ZIP file format is a lossless compression format, which means that if you compress the multiple files using ZIP format you can fully recover the data after decompressing the ZIP file. ZIP file format uses many compression algorithms for compressing the documents. You can easily identify a ZIP file by the .zip extension.
Reading a .ZIP file in Python
You can read a zip file by importing the “zipfile” package. Below is the python code which can read the “train.csv” file that is inside the “T.zip”.
import zipfile
archive = zipfile.ZipFile('T.zip', 'r')
df = archive.read('train.csv')
Here, I have discussed one of the famous archive format and how to open it in python. I am not mentioning other archive formats. If you want to read about different archive formats and their comparisons you can refer this link.
3.4 Plain Text (txt) file format
In Plain Text file format, everything is written in plain text. Usually, this text is in unstructured form and there is no meta-data associated with it. The txt file format can easily be read by any program. But interpreting this is very difficult by a computer program.
Let’s take a simple example of a text File.
The following example shows text file data that contain text:
“In my previous article, I introduced you to the basics of Apache Spark, different data representations
(RDD / DataFrame / Dataset) and basics of operations (Transformation and Action). We even solved a machine
learning problem from one of our past hackathons. In this article, I will continue from the place I left in
my previous article. I will focus on manipulating RDD in PySpark by applying operations
(Transformation and Actions).”
Suppose the above text written in a file called text.txt and you want to read this so you can refer the below code.
text_file = open("text.txt", "r")
lines = text_file.read()
3.5 JSON file format
JavaScript Object Notation(JSON) is a text-based open standard designed for exchanging the data over web. JSON format is used for transmitting structured data over the web. The JSON file format can be easily read in any programming language because it is language-independent data format.
Let’s take an example of a JSON file
The following example shows how a typical JSON file stores information of employees.
{
   "Employee": [

      {

         "id":"1",

         "Name": "Ankit",

         "Sal": "1000",

      },
      {

         "id":"2",

         "Name": "Faizy",

         "Sal": "2000",

      }

   ]

}
Reading a JSON file
Let’s load the data from JSON file. For loading the data you can use the pandas library in python.
import pandas as pd
df = pd.read_json(“/home/kunal/Downloads/Loan_Prediction/train.json”)
3.6 XML file format
XML is also known as Extensible Markup Language. As the name suggests, it is a markup language. It has certain rules for encoding data. XML file format is a human-readable and machine-readable file format. XML is a self-descriptive language designed for sending information over the internet. XML is very similar to HTML, but has some differences. For example, XML does not use predefined tags as HTML.
Let’s take the simple example of XML File format.
The following example shows an xml document that contains the information of an employee.
<?xml version="1.0"?>
<contact-info>

<name>Ankit</name>

<company>Anlytics Vidhya</company>

<phone>+9187654321</phone>

</contact-info>
The “<?xml version=”1.0″?>” is a XML declaration at the start of the file (it is optional). In this deceleration, version specifies the XML version and encoding specifies the character encoding used in the document. <contact-info> is a tag in this document. Each XML-tag needs to be closed.
Reading XML in python
For reading the data from XML file you can import xml.etree. ElementTree library.
Let’s import an xml file called train and print its root tag.
import xml.etree.ElementTree as ET
tree = ET.parse('/home/sunilray/Desktop/2 sigma/train.xml')
root = tree.getroot()
print root.tag
3.7 HTML files
HTML stands for Hyper Text Markup Language. It is the standard markup language which is used for creating Web pages. HTML is used to describe structure of web pages using markup. HTML tags are same as XML but these are predefined. You can easily identify HTML document subsection on basis of tags such as <head> represent the heading of HTML document. <p> “paragraph” paragraph in HTML. HTML is not case sensitive.
The following example shows an HTML document.
<!DOCTYPE html>
<html>
<head>
<title>Page Title</title>
</head>
<body><h1>My First Heading</h1>
<p>My first paragraph.</p></body>
</html>
Each tag in HTML is enclosed under the angular bracket(<>). The <!DOCTYPE html> tag defines that document is in HTML format. <html> is the root tag of this document. The <head> element contains heading part of this document. The <title>, <body>, <h1>, <p> represent the title, body, heading and paragraph respectively in the HTML document.
Reading the HTML file
For reading the HTML file, you can use BeautifulSoup library. Please refer to this tutorial, which will guide you how to parse HTML documents. Beginner’s guide to Web Scraping in Python (using BeautifulSoup)
3.8 Image files
Image files are probably the most fascinating file format used in data science. Any computer vision application is based on image processing. So it is necessary to know different image file formats.
Usual image files are 3-Dimensional, having RGB values. But, they can also be 2-Dimensional (grayscale) or 4-Dimensional (having intensity) – an Image consisting of pixels and meta-data associated with it.
Each image consists one or more frames of pixels. And each frame is made up of two-dimensional array of pixel values. Pixel values can be of any intensity. Meta-data associated with an image, can be an image type (.png) or pixel dimensions.
Let’s take the example of an image by loading it.
from scipy import misc
f = misc.face()
misc.imsave('face.png', f) # uses the Image module (PIL)
import matplotlib.pyplot as plt
plt.imshow(f)
plt.show()

Now, let’s check the type of this image and its shape.
type(f) , f.shape
numpy.ndarray,(768, 1024, 3)
If you want to read about image processing you can refer this article. This article will teach you image processing with an example – Basics of Image Processing in Python
3.9 Hierarchical Data Format (HDF)
In Hierarchical Data Format ( HDF ), you can store a large amount of data easily. It is not only used for storing high volumes or complex data but also used for storing small volumes or simple data.
The advantages of using HDF are as mentioned below:
- It can be used in every size and type of system
- It has flexible, efficient storage and fast I/O.
- Many formats support HDF.
There are multiple HDF formats present. But, HDF5 is the latest version which is designed to address some of the limitations of the older HDF file formats. HDF5 format has some similarity with XML. Like XML, HDF5 files are self-describing and allow users to specify complex data relationships and dependencies.
Let’s take the example of an HDF5 file format which can be identified using .h5 extension.

Read the HDF5 file
You can read the HDF file using pandas. Below is the python code can load the train.h5 data into the “t”.
t = pd.read_hdf(‘train.h5’)
3.10 PDF file format
PDF (Portable Document Format) is an incredibly useful format used for interpretation and display of text documents along with incorporated graphics. A special feature of a PDF file is that it can be secured by a password.
Here’s an example of a pdf file.
Reading a PDF file
On the other hand, reading a PDF format through a program is a complex task. Although there exists a library which do a good job in parsing PDF file, one of them is PDFMiner. To read a PDF file through PDFMiner, you have to:
- Download PDFMiner and install it through the website
- Extract PDF file by the following code
pdf2txt.py <pdf_file>.pdf
3.11 DOCX file format
Microsoft word docx file is another file format which is regularly used by organizations for text based data. It has many characteristics, like inline addition of tables, images, hyperlinks, etc. which helps in making docx an incredibly important file format.
The advantage of a docx file over a PDF file is that a docx file is editable. You can also change a docx file to any other format.
Here’s an example of a docx file:

Reading a docx file
Similar to PDF format, python has a community contributed library to parse a docx file. It is called python-docx2txt.
Installing this library is easy through pip by:
pip install docx2txt
To read a docx file in Python use the following code:
import docx2txt
text = docx2txt.process("file.docx")
3.12 MP3 file format
MP3 file format comes under the multimedia file formats. Multimedia file formats are similar to image file formats, but they happen to be one the most complex file formats.
In multimedia file formats, you can store variety of data such as text image, graphical, video and audio data. For example, A multimedia format can allow text to be stored as Rich Text Format (RTF) data rather than ASCII data which is a plain-text format.
MP3 is one of the most common audio coding formats for digital audio. A mp3 file format uses the MPEG-1 (Moving Picture Experts Group – 1) encoding format which is a standard for lossy compression of video and audio. In lossy compression, once you have compressed the original file, you cannot recover the original data.
A mp3 file format compresses the quality of audio by filtering out the audio which can not be heard by humans. MP3 compression commonly achieves 75 to 95% reduction in size, so it saves a lot of space.
mp3 File Format Structure
A mp3 file is made up of several frames. A frame can be further divided into a header and data block. We call these sequence of frames an elementary stream.
A header in mp3 usually, identify the beginning of a valid frame and a data blocks contain the (compressed) audio information in terms of frequencies and amplitudes. If you want to know more about mp3 file structure you can refer this link.
Reading the multimedia files in python
For reading or manipulating the multimedia files in Python you can use a library called PyMedia.
3.13 MP4 file format
MP4 file format is used to store videos and movies. It contains multiple images (called frames), which play in form of a video as per a specific time period. There are two methods for interpreting a mp4 file. One is a closed entity, in which the whole video is considered as a single entity. And other is mosaic of images, where each image in the video is considered as a different entity and these images are sampled from the video.
Here’s is an example of mp4 video

Reading an mp4 file
MP4 also has a community built library for reading and editing mp4 files, called MoviePy.
You can install the library from this link. To read a mp4 video clip, in Python use the following code.
from moviepy.editor import VideoFileClip
clip = VideoFileClip(‘<video_file>.mp4’)
You can then display this in jupyter notebook as below
ipython_display(clip)
End Notes
In this article, I have introduced you to some of the basic file formats, which are used by data scientist on a day to day basis. There are many file formats I have not covered. Good thing is that I don’t need to cover all of them in one article.
I hope you found this article helpful. I would encourage you to explore more file formats. Good luck! If you still have any difficulty in understanding a specific data format, I’d like to interact with you in comments. If you have any more doubts or queries feel free to drop in your comments below.
There is a subtle difference between data and information. Data are the facts or details from which information is derived. Individual pieces of data are rarely useful alone. For data to become information, data needs to be put into context.
Comparison chart
| Data | Information | |
|---|---|---|
| Meaning | Data is raw, unorganized facts that need to be processed. Data can be something simple and seemingly random and useless until it is organized. | When data is processed, organized, structured or presented in a given context so as to make it useful, it is called information. |
| Example | Each student's test score is one piece of data. | The average score of a class or of the entire school is information that can be derived from the given data. |
| Etymology | "Data" comes from a singular Latin word, datum, which originally meant "something given." Its early usage dates back to the 1600s. Over time "data" has become the plural of datum. | "Information" is an older word that dates back to the 1300s and has Old French and Middle English origins. It has always referred to "the act of informing, " usually in regard to education, instruction, or other knowledge communication. |
Data vs. Information - Differences in Meaning
"The numbers have no way of speaking for themselves. We speak for them. We imbue them with meaning." —Statistician Nate Silver in the book The Signal and the Noise
Data are simply facts or figures — bits of information, but not information itself. When data are processed, interpreted, organized, structured or presented so as to make them meaningful or useful, they are called information. Information provides context for data.
For example, a list of dates — data — is meaningless without the information that makes the dates relevant (dates of holiday).
"Data" and "information" are intricately tied together, whether one is recognizing them as two separate words or using them interchangeably, as is common today. Whether they are used interchangeably depends somewhat on the usage of "data" — its context and grammar.
Examples of Data and Information
- The history of temperature readings all over the world for the past 100 years is data. If this data is organized and analyzed to find that global temperature is rising, then that is information.
- The number of visitors to a website by country is an example of data. Finding out that traffic from the U.S. is increasing while that from Australia is decreasing is meaningful information.
- Often data is required to back up a claim or conclusion (information) derived or deduced from it. For example, before a drug is approved by the FDA, the manufacturer must conduct clinical trials and present a lot of data to demonstrate that the drug is safe.
"Misleading" Data
Because data needs to be interpreted and analyzed, it is quite possible — indeed, very probable — that it will be interpreted incorrectly. When this leads to erroneous conclusions, it is said that the data are misleading. Often this is the result of incomplete data or a lack of context. For example, your investment in a mutual fund may be up by 5% and you may conclude that the fund managers are doing a great job. However, this could be misleading if the major stock market indices are up by 12%. In this case, the fund has underperformed the market significantly.
What is Data?
Data is a raw and unorganized fact that required to be processed to make it meaningful. Data can be simple at the same time unorganized unless it is organized. Generally, data comprises facts, observations, perceptions numbers, characters, symbols, image, etc.
Data is always interpreted, by a human or machine, to derive meaning. So, data is meaningless. Data contains numbers, statements, and characters in a raw form.
What is Information?
Information is a set of data which is processed in a meaningful way according to the given requirement. Information is processed, structured, or presented in a given context to make it meaningful and useful.
It is processed data which includes data that possess context, relevance, and purpose. It also involves manipulation of raw data.
Information assigns meaning and improves the reliability of the data. It helps to ensure undesirability and reduces uncertainty. So, when the data is transformed into information, it never has any useless details.

Data Vs. Information
| Parameters | Data | Information |
|---|---|---|
| Description | Qualitative Or QuantitativeVariables which helps to develop ideas or conclusions. | It is a group of data which carries news and meaning. |
| Etymology | Data comes from a Latin word, datum, which means "To give something." Over a time "data" has become the plural of datum. | Information word has old French and middle English origins. It has referred to the "act of informing.". It is mostly used for education or other known communication. |
| Format | Data is in the form of numbers, letters, or a set of characters. | Ideas and inferences |
| Represented in | It can be structured, tabular data, graph, data tree, etc. | Language, ideas, andthoughts based on the given data. |
| Meaning | Data does not have any specific purpose. | It carries meaning that has been assigned by interpreting data. |
| Interrelation | Information that is collected | Information that is processed. |
| Feature | Data is a single unit and is raw. It alone doesn't have any meaning. | Information is the product and group of data which jointly carry a logical meaning. |
| Dependence | It never depends on Information | It depended on Data. |
| Measuring unit | Measured in bits and bytes. | Measured in meaningful units like time, quantity, etc. |
| Support for Decision making | It can't be used for decision making | It is widely used for decision making. |
| Contains | Unprocessed raw factors | Processed in a meaningful way |
| Knowledge level | It is low-level knowledge. | It is the second level of knowledge. |
| Characteristic | Data is the property of an organization and is not available for sale to the public. | Information is available for sale to the public. |
| Dependency | Data depends upon the sources for collecting data. | Information depends upon data. |
| Example | Ticket sales on a band on tour. | Sales report by region and venue. It gives information which venue is profitable for that business. |
| Significance | Data alone has no signifiance. | Information is significant by itself. |
| Meaning | Data is based on records and observations and, which are stored in computers or remembered by a person. | Information is considered more reliable than data. It helps the researcher to conduct a proper analysis. |
| Usefulness | The data collected by the researcher, may or may not be useful. | Information is useful and valuable as it is readily available to the researcher for use. |
| Dependency | Data is never designed to the specific need of the user. | Information is always specific to the requirements and expectations because all the irrelevant facts and figures are removed, during the transformation process. |
DIKW (Data Information Knowledge Wisdom)
Conclusion
- Data is a raw and unorganized fact that required to be processed to make it meaningful.
- Information is a set of data which is processed in a meaningful way according to the given requirement.
- Data comes from a Latin word, datum, which means "To give something."
- Information word has old French and middle English origins. It has referred to the "act of informing.".
- Data is in the form of numbers, letters, or a set of characters.
- Information is mainly in the form of Ideas and inferences.
- DIKW is the model used for discussion of data, information, knowledge, wisdom and their interrelationships
Research process starts with the collection of data, which plays a significant role in the statistical analysis. We quite commonly use the term ‘data’ in the different context. However, in general, it indicates the facts or statistics gathered by the researcher for analysis in their original form. When the data is processed and transformed in such a way that it becomes useful to the users, it is known as ‘information’.
While data is an unsystematic fact or detail about something, information is a systematic and filtered form of data, which is useful. In this articl, you can find all the important differences between data and information.
Content: Data Vs Information
Comparison Chart
| BASIS FOR COMPARISON | DATA | INFORMATION |
|---|---|---|
| Meaning | Data means raw facts gathered about someone or something, which is bare and random. | Facts, concerning a particular event or subject, which are refined by processing is called information. |
| What is it? | It is just text and numbers. | It is refined data. |
| Based on | Records and Observations | Analysis |
| Form | Unorganized | Organized |
| Useful | May or may not be useful. | Always |
| Specific | No | Yes |
| Dependency | Does not depend on information. | Without data, information cannot be processed. |
Definition of Data
Data is defined as the collection of facts and details like text, figures, observations, symbols or simply description of things, event or entity gathered with a view to drawing inferences. It is the raw fact, which should be processed to gain information. It is the unprocessed data, that contains numbers, statements and characters before it is refined by the researcher
The term data is derived from Latin term ‘datum’ which refers to ‘something given’. The concept of data is connected with scientific research, which is collected by various organisations, government departments, institutions and non-government agencies for a variety of reasons. There can be two types of data:
Primary Data
Qualitative Data
Quantitative Data
Secondary Data
Internal Data
External Data
Definition of Information
Information is described as that form of data which is processed, organised, specific and structured, which is presented in the given setting. It assigns meaning and improves the reliability of the data, thus ensuring understandability and reduces uncertainty. When the data is transformed into information, it is free from unnecessary details or immaterial things, which has some value to the researcher.
The term information discovered from the Latin word ‘informare’, which refers to ‘give form to’. Raw data is not at all meaningful and useful as information. It is refined and cleaned through purposeful intelligence to become information. Therefore data is manipulated through tabulation, analysis and similar other operations which enhance the explanation and interpretation.
Key Differences Between Data and Information
The points given below are substantial, so far as the difference between data and information is concerned:
Raw facts gathered about a condition, event, idea, entity or anything else which is bare and random, is called data. Information refers to facts concerning a particular event or subject, which are refined by processing.
Data are simple text and numbers, while information is processed and interpreted data.
Data is in an unorganized form, i.e. it is randomly collected facts and figures which are processed to draw conclusions. On the other hand, when the data is organised, it becomes information, which presents data in a better way and gives meaning to it.
Data is based on observations and records, which are stored in computers or simply remembered by a person. As against this, information is considered more reliable than data, as a proper analysis is conducted to convert data into information by the researcher or investigator.
The data collected by the researcher, may or may not be useful to him, as when the data is gathered, it is not known what they are about or what they represent? Conversely, information is valuable and useful to the researcher because it is presented in the given context and so readily available to the researcher for use.
Data is not always specific to the need of the researcher, but information is always specific to his requirements and expectations, because all the irrelevant facts and figures are eliminated, during the transformation of data into information.
When it comes to dependency, data does not depend on information. However, information cannot exist without data.
Conclusion
In simple terms, data is unorganised information and information is processed data. These two terms are so closely intertwined that it is quite common for people to juxtapose them. In the technical glossary, data means input, used to generate output, i.e. information.
Data are those facts and descriptions from which information can be extracted. Data alone has no certain meaning, i.e. until and unless the data is explained and interpreted, it is just a collection of numbers, words and symbols. Unlike information, which does not lack meaning in fact they can be understood by the users in normal diligence.
Data collection plays a very crucial role in the statistical analysis. In research, there are different methods used to gather information, all of which fall into two categories, i.e. primary data, and secondary data. As the name suggests, primary data is one which is collected for the first time by the researcher while secondary data is the data already collected or produced by others
Difference Between Primary and Secondary Data
 Data collection plays a very crucial role in the statistical analysis. In research, there are different methods used to gather information, all of which fall into two categories, i.e. primary data, and secondary data. As the name suggests, primary data is one which is collected for the first time by the researcher while secondary data is the data already collected or produced by others.
There are many differences between primary and secondary data, which are discussed in this article. But the most important difference is that primary data is factual and original whereas secondary data is just the analysis and interpretation of the primary data. While primary data is collected with an aim for getting solution to the problem at hand, secondary data is collected for other purposes.
Content: Primary Data Vs Secondary Data
Comparison Chart
| BASIS FOR COMPARISON | PRIMARY DATA | SECONDARY DATA |
|---|---|---|
| Meaning | Primary data refers to the first hand data gathered by the researcher himself. | Secondary data means data collected by someone else earlier. |
| Data | Real time data | Past data |
| Process | Very involved | Quick and easy |
| Source | Surveys, observations, experiments, questionnaire, personal interview, etc. | Government publications, websites, books, journal articles, internal records etc. |
| Cost effectiveness | Expensive | Economical |
| Collection time | Long | Short |
| Specific | Always specific to the researcher's needs. | May or may not be specific to the researcher's need. |
| Available in | Crude form | Refined form |
| Accuracy and Reliability | More | Relatively less |
Definition of Primary Data
Primary data is data originated for the first time by the researcher through direct efforts and experience, specifically for the purpose of addressing his research problem. Also known as the first hand or raw data. Primary data collection is quite expensive, as the research is conducted by the organisation or agency itself, which requires resources like investment and manpower. The data collection is under direct control and supervision of the investigator.
The data can be collected through various methods like surveys, observations, physical testing, mailed questionnaires, questionnaire filled and sent by enumerators, personal interviews, telephonic interviews, focus groups, case studies, etc.
Definition of Secondary Data
Secondary data implies second-hand information which is already collected and recorded by any person other than the user for a purpose, not relating to the current research problem. It is the readily available form of data collected from various sources like censuses, government publications, internal records of the organisation, reports, books, journal articles, websites and so on.
Secondary data offer several advantages as it is easily available, saves time and cost of the researcher. But there are some disadvantages associated with this, as the data is gathered for the purposes other than the problem in mind, so the usefulness of the data may be limited in a number of ways like relevance and accuracy.
Moreover, the objective and the method adopted for acquiring data may not be suitable to the current situation. Therefore, before using secondary data, these factors should be kept in mind.
Key Differences Between Primary and Secondary Data
The fundamental differences between primary and secondary data are discussed in the following points:
The term primary data refers to the data originated by the researcher for the first time. Secondary data is the already existing data, collected by the investigator agencies and organisations earlier.
Primary data is a real-time data whereas secondary data is one which relates to the past.
Primary data is collected for addressing the problem at hand while secondary data is collected for purposes other than the problem at hand.
Primary data collection is a very involved process. On the other hand, secondary data collection process is rapid and easy.
Primary data collection sources include surveys, observations, experiments, questionnaire, personal interview, etc. On the contrary, secondary data collection sources are government publications, websites, books, journal articles, internal records etc.
Primary data collection requires a large amount of resources like time, cost and manpower. Conversely, secondary data is relatively inexpensive and quickly available.
Primary data is always specific to the researcher’s needs, and he controls the quality of research. In contrast, secondary data is neither specific to the researcher’s need, nor he has control over the data quality.
Primary data is available in the raw form whereas secondary data is the refined form of primary data. It can also be said that secondary data is obtained when statistical methods are applied to the primary data.
Data collected through primary sources are more reliable and accurate as compared to the secondary sources.
Conclusion
As can be seen from the above discussion that primary data is an original and unique data, which is directly collected by the researcher from a source according to his requirements. As opposed to secondary data which is easily accessible but are not pure as they have undergone through many statistical treatments.
Data and Information are interrelated, as the data is the basic building block for the later. But, there are various key points that differ from each other.
Data is something that you can consider as the low level of knowledge. In this, you have some scattered, Uncategorized, unorganized entities that do not really mean anything. Whereas Information is the second level of knowledge where you wire up the data and assign them some context. So that, the data become meaningful.
Most of the people are aware of the data and information but still, there is some ambiguity in people about the difference between the data and information.
In this article, I am going to provide a brief explanation of what data and information are. Also, in this article, you’ll get to know the key difference between the two.
So, before differentiating the two on the basis of several factors, let me first throw some light on what data and information are.
What is data?
data
The term data was originated around the 1600s that comes from a singular Latin word datum, which means “something given”.
The dictionary meaning of the word data is, “Facts and statistics collected together for reference or analysis”.
And according to the philosophy data means, “Things known or assumed as facts, making the basis of reasoning or calculation”.
*Reference: According to the Oxford dictionary
And generally, we say, “Data is a collection of raw facts and figures that we need to process to extract meaning or information”.
As per the definition, data is something that we have as raw entities. These entities can be any number(0 to 9), characters (A to Z, a to z), text, words, statements or even special characters (*, /, @, #, etc…).
Furthermore, pictures, sound, or videos that are contextless, means little or nothing to a human being and lies in the category of data. Example: Will Turner, 48, link down, blue, junior, ocean, street
Data is nothing unless it is processed or it is aligned in some context. The data when structured and organized i.e; when the data is processed in some manner then the result or the output is the Information.
As for the above example, the data is raw and there is no meaning to it but if we organize this data:
Will tuner
H.no- 48, blue ocean
link down street
Now, this looks like an Adress of the person named Will Turner. Whereas, in the above example it is impossible to make out a meaning of the words.
What is information?
The term information was originated around the 1300s i.e; before the term data. The information word comes from a singular old English word informare, which refers to “the act of informing”.
The dictionary meaning of the word information is, “knowledge gained through study, communication, research, instruction, etc.”.
In term of computers, the term information means, “important or useful facts obtained as output from a computer by means of processing input data with a program”.
*Reference: According to the dictionary
Apart from these, generally we consider information as, “a processed data that is organized, structured or presented in a given context so that the data deliver some logical meaning that may be further utilized in decision making”.
The information that you get after the processing of data is abstract and free from any sort of unnecessary details. This information is precise and conveys a straightforward meaning to the output that you get from the processing of the raw and meaningless data.
The information you get from the processing of data is utilized for some further judgment.
The information has four main uses that are as following:
1. Planning
To plan accurately, a business must know the resources it has. Example: People, Properties, clients, customers, dealers, Types of machinery, Accounts etc.
With all the above information it becomes easier for the business to look into the market and plan strategies to overtake the actions of the competitors.
At the planning stage, the information is the key ingredient in business level decision making.
2. Recording
Recording of each transaction and event is must for a business. It is important to record the information like the expenses and income as per the law for management of the taxes. A business also keeps rethe cord of the marketing and the sale or purchase of the products so that they can keep track of customers behavior about the purchase of products.
If we say in other contexts like school and universities keep track of the number of admissions per year and the number of students that pass out per year to make further decisions.
3. Analysis
You can utilize this information for the analysis purpose. The analysis includes the sales, costs, and profits etc.
The analysis gives a broad figure of the overall profit or loss of the organization. Based on this analysis the business can make decisions that will optimize the costs and the profits in the best way.
4. Controlling
Once, a business has all the record data and the overall analysis, then it will be easier for it to control and enhance the resources.
Hence, the information helps in identifying whether the things are going better or worse than the expectation.
Accordingly, the business can control the expenses and manage resources to attain what is in the expectation.
The information that is in the use of decision making purpose are of three types:
Strategic information: This information helps in planning the objectives of an organization. It also helps to measure the achievements of the objectives.
Tactical Information: This information decides how to employ the resources to attain the maximum productivity.
Operational Information: This information make sure that the tasks and operations are carrying out according to the strategy. This includes that the tasks are completing on time and things are going in a proper manner.
Now, as you have an understanding of the data and information. Let me explain the ten key difference points between both with some real-life examples.
Difference between Data and Information
1. Significance
The very first key difference between the data and information depends on the significance. Information is significant. Whereas, the data is not significant.
It means that the stand-alone data is of no use. There is no meaning that can be derived from raw data and it cannot be utilized anywhere.
On the other hand, the Information is significant as it has some context and provides some meaning. With the information allows taking some action on behalf of it.
With a meaningful data i.e Information, an organization or a business entity can take a decision.
For example, The costs and selling statistics of a product of an E-commerce website when presented in the raw tabular form is not significant. But, when this data is represented within the context of the target customer and the behavior of the customer of purchasing or not purchasing the product. Then this stats become significant as a decision can be taken out on this information.
2. Representation
You can visualize data in a structured form such as tabular data, data tree, data graph etc…
In the tabular format, there is a table with different rows and columns and each column or row represent a data entity.
The data tree format stimulates a hierarchical tree structure with a root node and a number of child nodes.
A data graph is a graphical representation of the data as a bar chart, line chart or a pie chart. The figure below depicts the data graph.
data-representation
Now, coming to the point of information. Information is seen as Language, ideas, and thoughts that are based on the data.
3. Form
The data is in raw form. Basically, the data is in the form of Numbers, letters or a set of characters. It also includes the symbols, picture or audio data. This raw data is scattered and is not aligned with some context.
Whereas the Information is in the form of idea and inference or conclusions that are based on the data. The raw data is analyzed and organized in the whatever context and only the necessary data is kept and the rest is discarded.
For instance, consider the below number:
02011994
This figure is a data entity and doesn’t provide any meaning.
To convert this data into information we need to keep it in some context. Let’s think of a context like a birthdate – 02/01/1994 i.e; Jan 02 1994.
You can interpret the same number as an account number or a mobile number.
4. Reliability
If we talk in the term of reliability then obviously the information wins on this. The information is reliable as it conveys some meaning and there are proper organization and dedication to a single context.
On the other hand, as data is raw and can be provided in any context. Moreover, with every context and structure the output or the meaning of the data changes. Hence, the data is unreliable when compared to Information.
Consider the example above of the number 02011994.
When it is in the form of the date of birth i.e; 02/01/1994 then it depicts a straightforward meaning. This has a clear context.
But if we consider the number only, then it converts into any form and provides a number of meanings that change according to the context.
5. Dependency
In the terms of dependency, the data is independent. As you know the data is raw and data can contain anything. Hence, the data does not depend on any sort of condition or circumstances. It can stand alone.
But, the information depends completely on the data. You cannot process the information witout the data. Data is the very basic building block of the information.
If there is no data then there will be no information.
6. Input and Output
data-and-information-input-process-and-output-5-728
This is the easiest way to differentiate between the two. Data is something that you give as an input for processing. After processing what you get as output is the information.
Let’s take an example of a collage maker application. You provide different photographs that you want to arrange in the collage as the input to the application. After providing the images, the images are processed and aligned according to the chosen theme. In the end, You get a single collage image as the output from the application.
7. Decision Making
You cannot take a decision based on the data while you can take a decision based upon the information.
To take a decision on a situation the very first thing is that you must know and understand the conditions and the circumstances correctly. This is possible only if you have the correct information.
Information plays a vital role in the process of decision making. The actions that a person takes is based on the information that it has.
But if we say about data, as data is raw and is meaningless so it is useless in decision making. You can not take a decision on the basis of raw fact and figures. And if you do so then there is a high priority that the decision may be wrong as it will rely on assumptions.
8. Based on observations
Data is based on the observations and records. The statistics and the tables of collections of figures are the sources of data.
And the source of information is data. Moreover, the information is based on the context that is in the alignment of data.
9. Analysis
The Data is never analyzed in its initial form. Once data is analyzed nor the analysis of data is done, the data becomes information at the same moment.
It means that the information is always analyzed. whereas, the data is never in the analyzed form. Once data is analyzed it is converted into information.
10. Usefulness
The last term of differentiation is the matter of usefulness. Both the data and information are useful in their own terms as the data is the base to create the information. Without the data, there is no information.
But if you see it from the perspective of a business. Then, the data is not so much important as there is a whole lot of processing needs to be done on data to make it useful or understand something out of it.
On the other hand, the Information is always useful as it provides some meaning for further decision making.
Hence, the information is always way more useful than the data.
First Things First: Data vs Information
There’s a really simple way to understand the difference between data and information. When we understand the primary function of the item we are looking at, we quickly see the distinction between the two.
Here’s a simple way to tell one from the other:
- Computers need data. Humans need information.
- Data is a building block. Information gives meaning and context.
In essence, data is raw. It has not been shaped, processed or interpreted. It is a series of 1s and zeros that humans would not be able to read (and nor would they want to). It is disorganised and unfriendly.
Once data has been processed and turned into information, it becomes palatable to human readers. It takes on context and structure. It becomes useful for businesses to make decisions, and it forms the basis of progress.
While the bigger picture is slightly more complex, this gets us part way towards understanding what data means.
The Bigger Picture
When we look at the relationship between data and information, we can establish a larger chain. This is the DIKW Pyramid.
Why DIKW? It stands for Data, Information, Knowledge, Wisdom, and describes the hierarchy between all four.
The DIKW Pyramid describes the acquisition of data, its processing, retention and interpretation, and it’s as applicable to businesses as it is to the human brain.

- Data: I have one item. The data displays a 1, not a zero.
- Information: It’s a tomato. Now, we understand the item and its characteristics.
- Knowledge: A tomato is a fruit. We can identify patterns in the information and apply them to the item.
- Wisdom: Tomato is never added to a fruit salad. There is an underlying, commonly understood principle that governs the item’s purpose.
Data Quality: The Building Block
In this article, we have truly put data in context. We now understand its position as the foundation. It is the base of a pyramid; the beginning of a continuum.
If data is flawed, the DIKW Pyramid breaks down. The information we derive from the data is not accurate. We cannot make reliable judgments or develop reliable knowledge from the information. And that knowledge simply cannot become wisdom, since cracks will appear as soon as it is tested.
Bad data costs time and effort, gives false impressions, results in poor forecasts and devalues everything else in the continuum.
Data quality software addresses problems with data to avoid these kinds of problems. It ensures that data processing results in reliable information that improves response and retention. This information unlocks the potential of marketing campaigns, increases sales, improves accuracy and adds value.
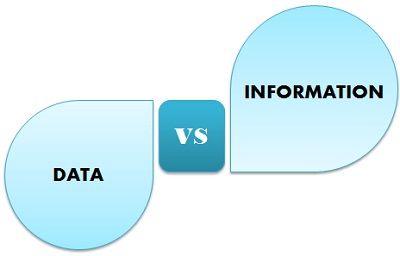 Data is raw, unanalyzed, unorganised, unrelated, uninterrupted material which is used to derive information, after analyzation. On the other hand, Information is perceivable, interpreted as a message in a particular manner, which provides meaning to data.
Data doesn’t interpret anything as it is a meaningless entity, while information is meaningful and relevant as well. Data and Information are different common terms which we frequently use, although there is a general interchangeability between these terms. So, our primary goal is to clarify the essential difference between Data and Information.
Content: Data Vs Information
Comparison Chart:
| BASIS FOR COMPARISON | DATA | INFORMATION |
|---|---|---|
| Meaning | Data is unrefined facts and figures and utilized as input for the computer system. | Information is the output of processed data. |
| Characteristics | Data is a individual unit which contains raw material and doesn't carry any meaning. | Information is the product and group of data which collectively carry a logical meaning. |
| Dependence | It doesn't depend on Information. | It relies on Data. |
| Peculiarity | Vague | Specific. |
| Measuring Unit | Measured in bits and bytes. | Measured in meaningful units like time, quantity, etc. |
Definition of Data :
Data is distinguishable information that is arranged in a particular format. Data word stems from a singular Latin word, Datum; its original meaning is “something given”. We have been using this word since 1600’s, and data turn into the plural of datum.
Data can adopt multiple forms like numbers, letters, set of characters, image, graphic, etc. If we talk about Computers, data is represented in 0’s and 1’s patterns which can be interpreted to represent a value or fact. Measuring units of data are Bit, Nibble, Byte, kB (kilobytes), MB (Megabytes), GB (Gigabytes), TB (Terabytes), PT (Petabyte), EB (Exabyte), ZB (Zettabytes), YT (Yottabytes), etc.
To store data, earlier punched cards were used, which were then replaced by magnetic tapes and hard disks.
There are two variants of data, Qualitative and Quantitative.
- Qualitative Data emerges when the categories present in data are distinctly separated under an observation and expressed through natural language.
- Quantitative Data is the numerical quantification which includes the counts and measurements and can be expressed in terms of numbers.
Data deteriorates as time passes.
Definition of Information :
Information is what you get after processing data. Data and facts can be analysed or used as an effort to gain knowledge and infer on a conclusion. In other words, accurate, systematize, understandable, relevant, and timely data is Information.
Information is an older word that we have been using since 1300’s and have a French and English origin. It is derived from the verb “informare” which means to inform and inform is interpreted as to form and develop an idea.
Information = Data + Meaning
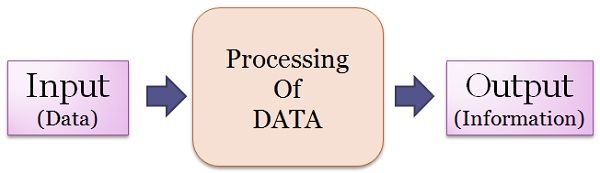
Unlike data, Information is a meaningful value, fact and figure which could derive something useful.
Let us take an example “5000” is data but if we add feet in it i.e. “5000 feet” it becomes information. If we keep on adding elements, it will reach the higher level of intelligence hierarchy as shown in the diagram.
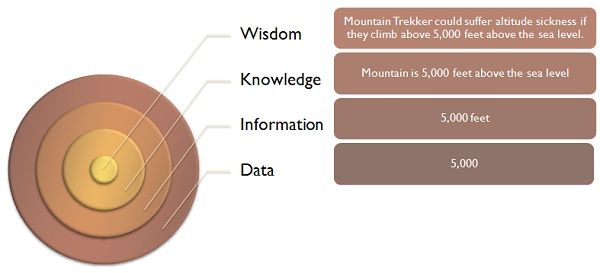
- Information is critical in a sense.
- There are various encoding techniques for interpretation and transmission of information.
- Information encryption is used for increasing the security during transmission and storage also.
Key Differences Between Data and Information
- Data is a single unit which contains raw facts and figures. In contrast, Information is the collection of useful data,which is able to provide knowledge or insight about particular manner.
- Information is derived from the data and hence, data does not rely upon information, but information does.
- Data is used as Input, which needs to be processed and organized in a particular fashion to generate output, i.e. information.
- Data couldn’t specify anything; there is no relation exists between chunks of data while Information is specific and there exists a correlation.
- Data has no real meaning whereas Information carries certain meaning.
Conclusion :
Data and Information, both the terms we use are a part of intelligence hierarchy and differ in the way that Data is not meaningful, but Information which is formed by the processed data is meaningful in context.
Data: The collection of raw facts and figures is called Data/input.
- Data is an input for computer.
- Data is independent.
- When data is lost, it can't be reproduced.
- Data is meaningless and valueless.
Data is Like: { NY, 550, John, marks }
Information: The processed form of data is called information/output.
- Information is an output from computer.
- Information is dependent on data.
- When information is lost, it can reproduced from data.
- Information is meaningful and valuable.